Monitoring Events
This procedure describes how to view Zend Server monitor events from Z-Ray.
What are monitor events?
How do I define event rules?
Note:
To use the Z-Ray, the page you are inspecting must be located on your Web server, and the Z-Ray needs to be enabled. For more information on enabling the Z-Ray, see Enabling / Disabling the Z-Ray.
|
|
|
|

|
To view events from Z-Ray:
- Open your page in a browser.
As soon and the page loads, Z-Ray is displayed at the bottom of the page.
- In Z-Ray, click the Monitor Events icon
 . .
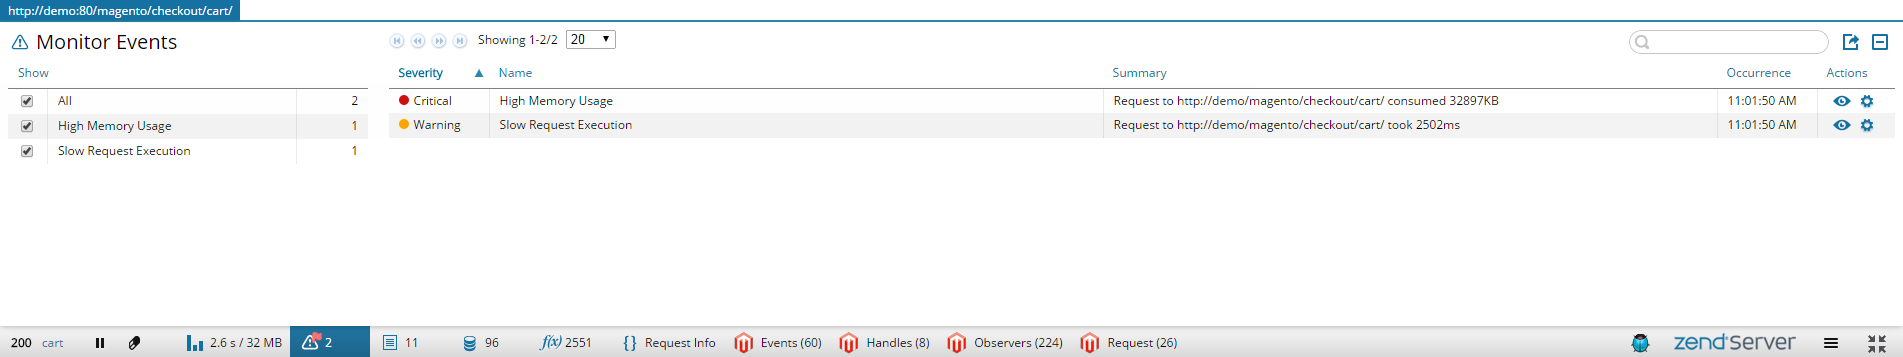
The Monitor Events panel is displayed.Note: You may see a message above the list in the panel, informing you that an 'x' number of rows are not displayed in the list. This means that there are rows that are filtered out due to default filtering configurations or filters you applied.
- Decide which events you would like to view by selecting one of the event name check-boxes (e.g., Slow Request Execution) in the Show Filter.
- To sort the information in the Events List, select one of the column titles.
- To further filter the Events list, enter a search string in the Search box.
Z-Ray will highlight results as you type.
- To see more event details in the Zend Server UI, in the Action column, click the Open Event in Zend Server icon
 . .
The Zend Server Event Details UI page is displayed with details on the relevant event.
- To view a code trace, click the code trace icon
 . . Note: This icon will only appear if a code trace was executed for the event as defined in the monitoring rule configurations. For more information, see Working with Event Rules.
|
| |
|