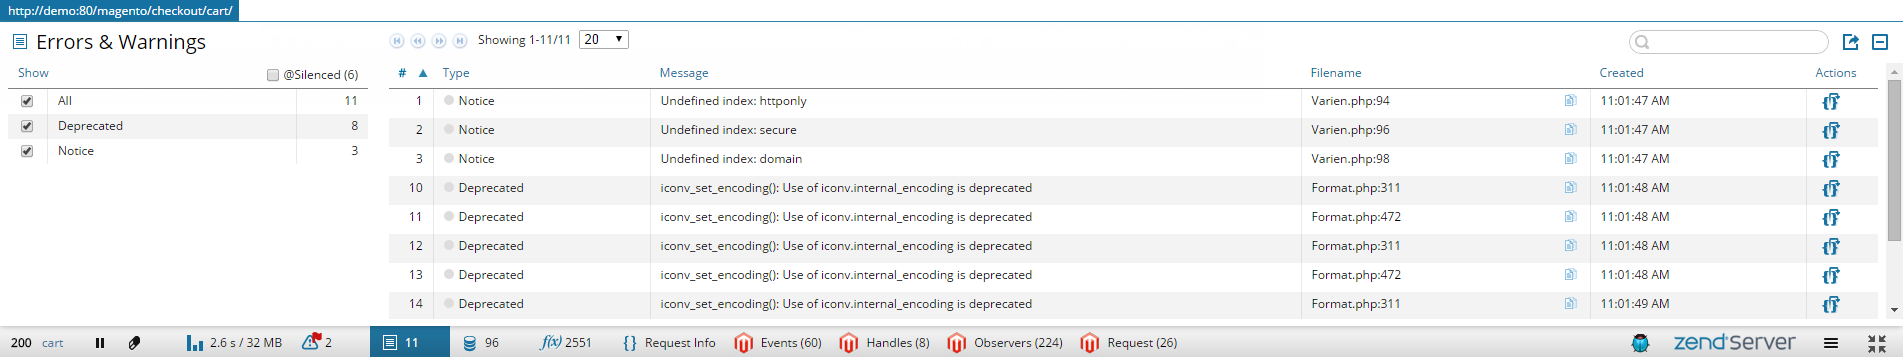
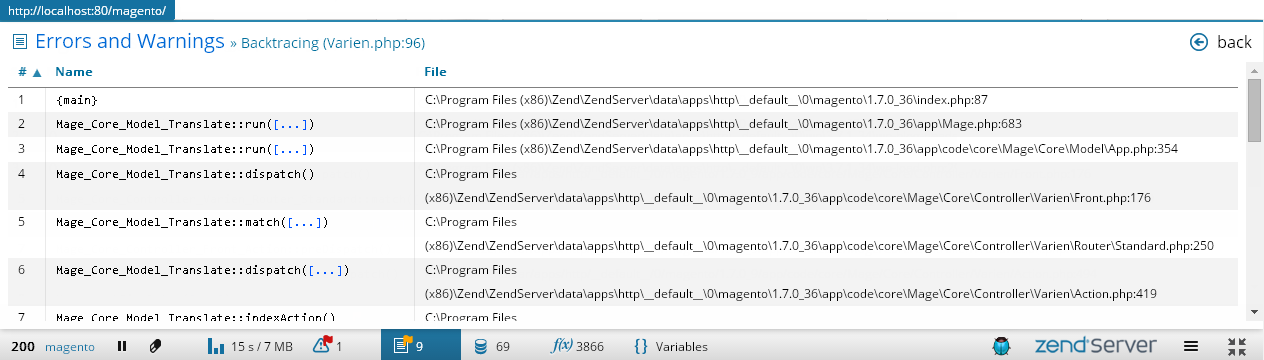
Viewing Errors and Warnings

This procedure describes how to view PHP errors with Z-Ray.

Note:

To use the Z-Ray, the page you are inspecting must be located on your Web server, and the Z-Ray needs to be enabled. For more information on enabling the Z-Ray, see Enabling / Disabling the Z-Ray.

Important:

Only errors triggered by PHP itself or by similar code functions (e.g., error_log) are displayed.


Instructions on how to complete a procedure

To view errors:

  1. Open your page in a browser.
    As soon and the page loads, Z-Ray is displayed at the bottom of the page.
  2. In Z-Ray, click the Errors & Warnings icon .
    The Errors and Warnings panel is displayed.

    Note:

    You may see a message above the list in the panel, informing you that an 'x' number of rows are not displayed in the list. This means that there are rows that are filtered out due to default filtering configurations or filters you applied.

  1. The Errors List shows errors as defined in your 'php.ini' configuration file. To filter these errors by type, select one of the entry type check-boxes (e.g., Notice) in the Show filter.
  2. To view silenced errors, select the @Silenced check-box in the Show filter.
    Silenced errors are displayed, and marked with @.
  3. To sort the information in the Errors List, select one of the column titles.
    For example, to see the last error created, click the Created column title.
  4. To further filter the Errors list, enter a search string in the Search box.
    Z-Ray will highlight results as you type.
  5. To copy the full path of the file, click the copy icon to the right of the file name and line number under the File name column.
  6. To view a backtrace of the error, click the Backtrace icon in the Actions column.
    The Backtrace panel is displayed.

  1. Click Back to return to the Errors and Warnings panel.