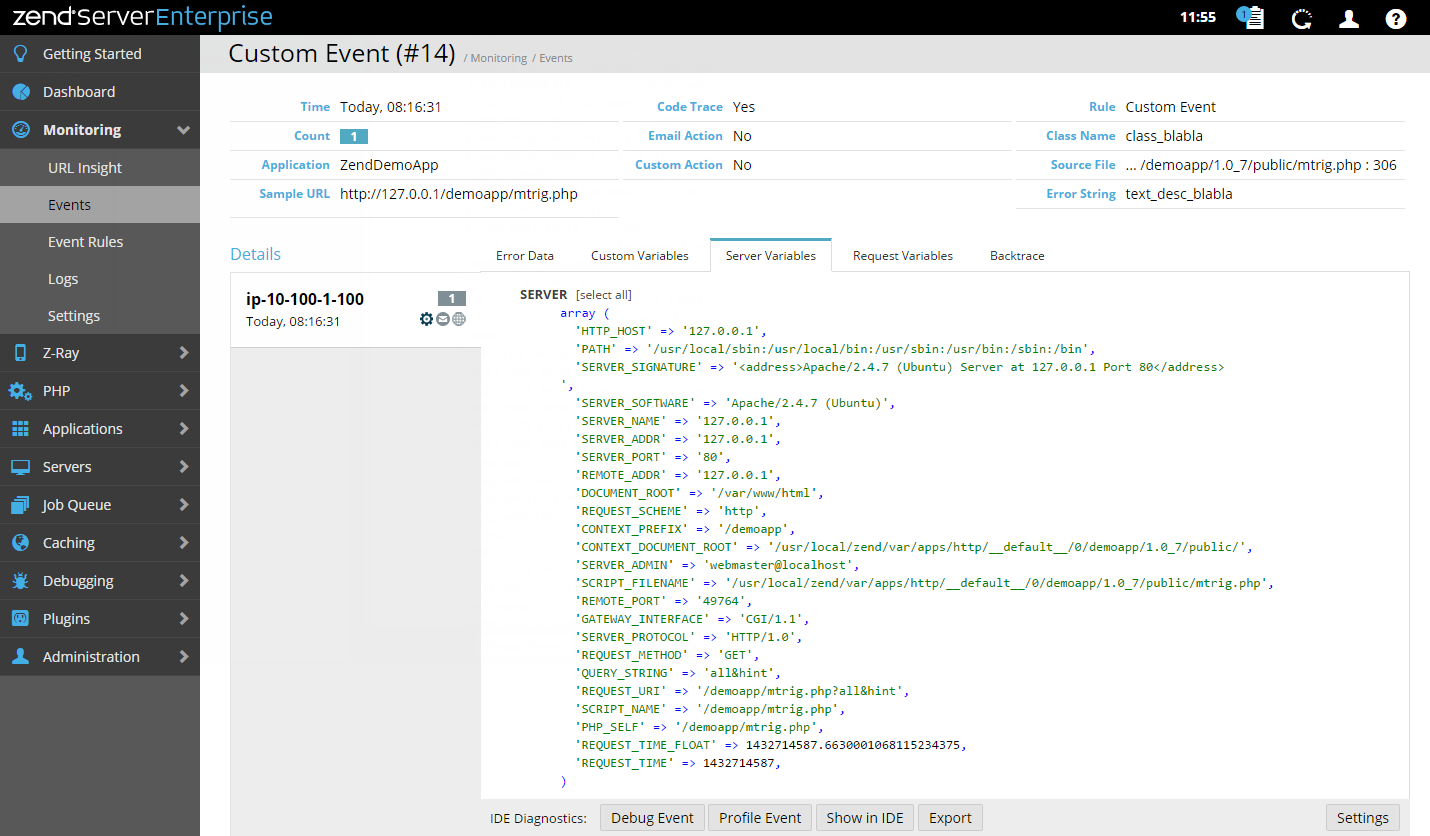
To access this option from the UI, go to Monitoring | Events, select an event from the list and click on the event's ID number to view the Event details page.
This procedure describes how to profile an event from inside Zend Server. Profiling from inside an event provides an additional diagnostics layer in order to investigate why a specific event was triggered by analyzing code execution performance with Zend Studio.
Important!
Before following this procedure make sure that Zend Server and Zend Studio are running and properly setup.
|
|
|
|
|
To Profile an event:
|
|
If this did not work, see the Troubleshooting section. |
|
 .
.


