What's New in Zend Server 9
This page will introduce you to the “latest and greatest” additions to Zend Server 9.
For deeper review on each new feature, please follow the links below to the elaborated feature pages.
PHP 7 - Powered by Zend Engine 3
Zend Server 9.0 marks the initial release of PHP 7 in our server side products, after Zend Studio 13.0, which was the initial version supporting PHP 7 projects on the IDE side. The entire Zend stack was engineered towards new major PHP 7 release, including Zend modules and extensions, PHP core and extensions, web servers and database connectors and Zend Server Admin UI.
PHP 7 features much improved design, runs real-world workloads (such as WordPress, Magento, Drupal, ZF apps, Laravel apps, etc.) twice as fast as PHP 5.6 (and often more).
Thanks to the reduced memory consumption, server density is often 3 times better compared to PHP 5.6.
Finally, numerous new features have been added, including catch-able language errors, typed returns, scalar type hints, anonymous classes and more.
For more information about specific PHP 7 aspects, improvements and features, please review the following references:
PHP.net - Migrating from PHP 5.6.x to PHP 7.0.x
Zend Blog post - PHP 7 Gaining Momentum
Code Tracing
Code Tracing page was completely remastered for Zend Server 9. Instead of the old Flash architecture which is lacking support on some operating systems, we have built a new set of pages for listing, running and analyzing code trace views.
The new Code Tracing design is built upon HTML5 and AngularJS, and provides a lot of options which were not possible before this version.
Compared to the old architecture, which loaded a flash object created by PHP from the Code Trace dump, the new architecture is using modern Web APIs to request the data in “chunks”, which initially loads the trace view faster, and more responsive with user actions.
Code Tracing - Traces Page:
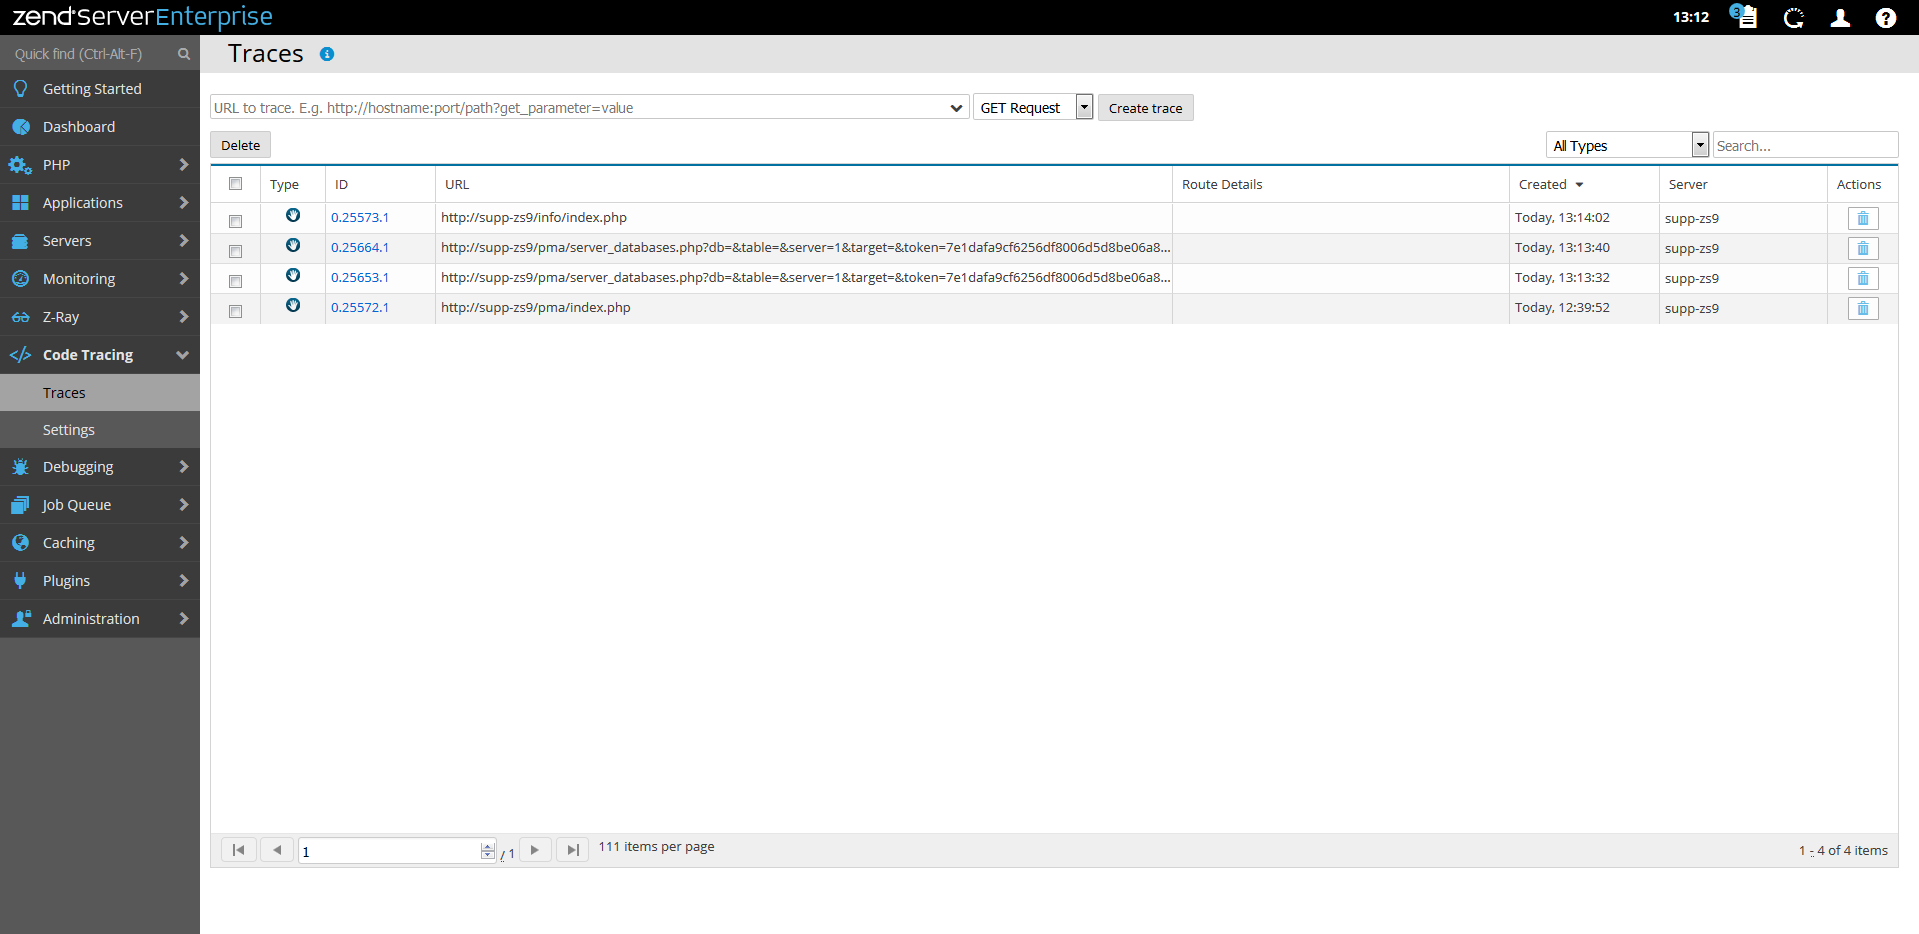
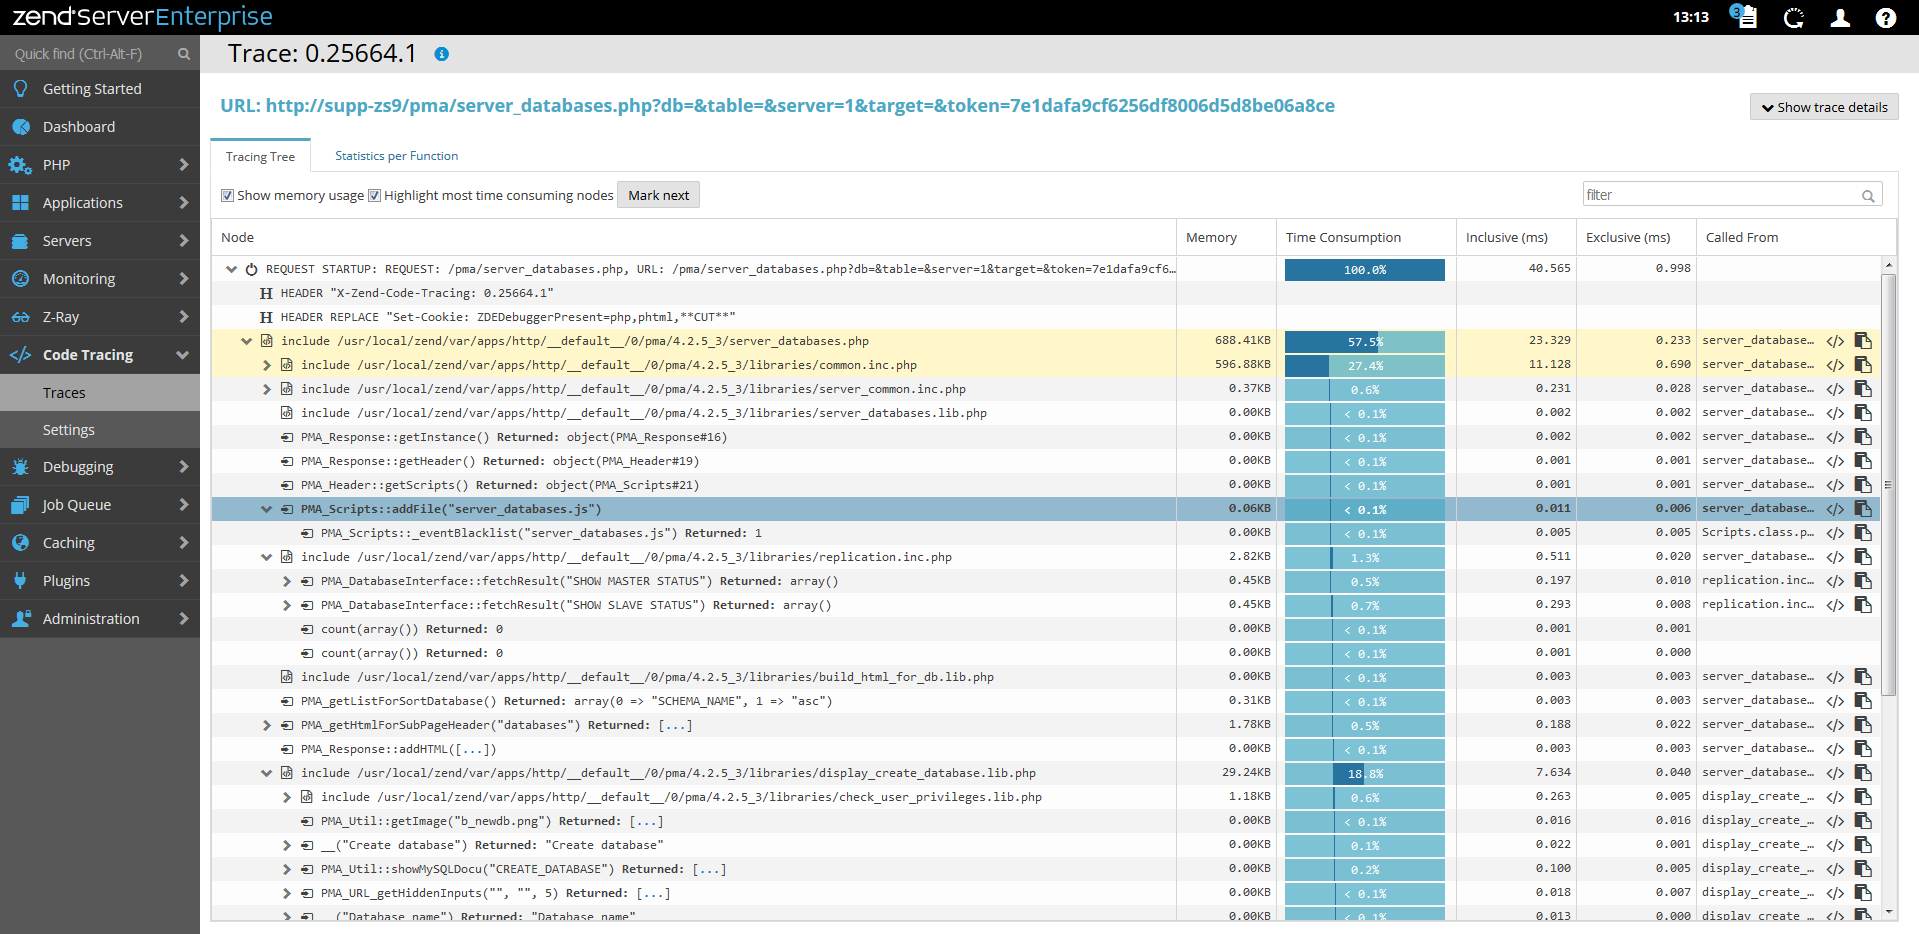
Code Tracing Tree Analysis
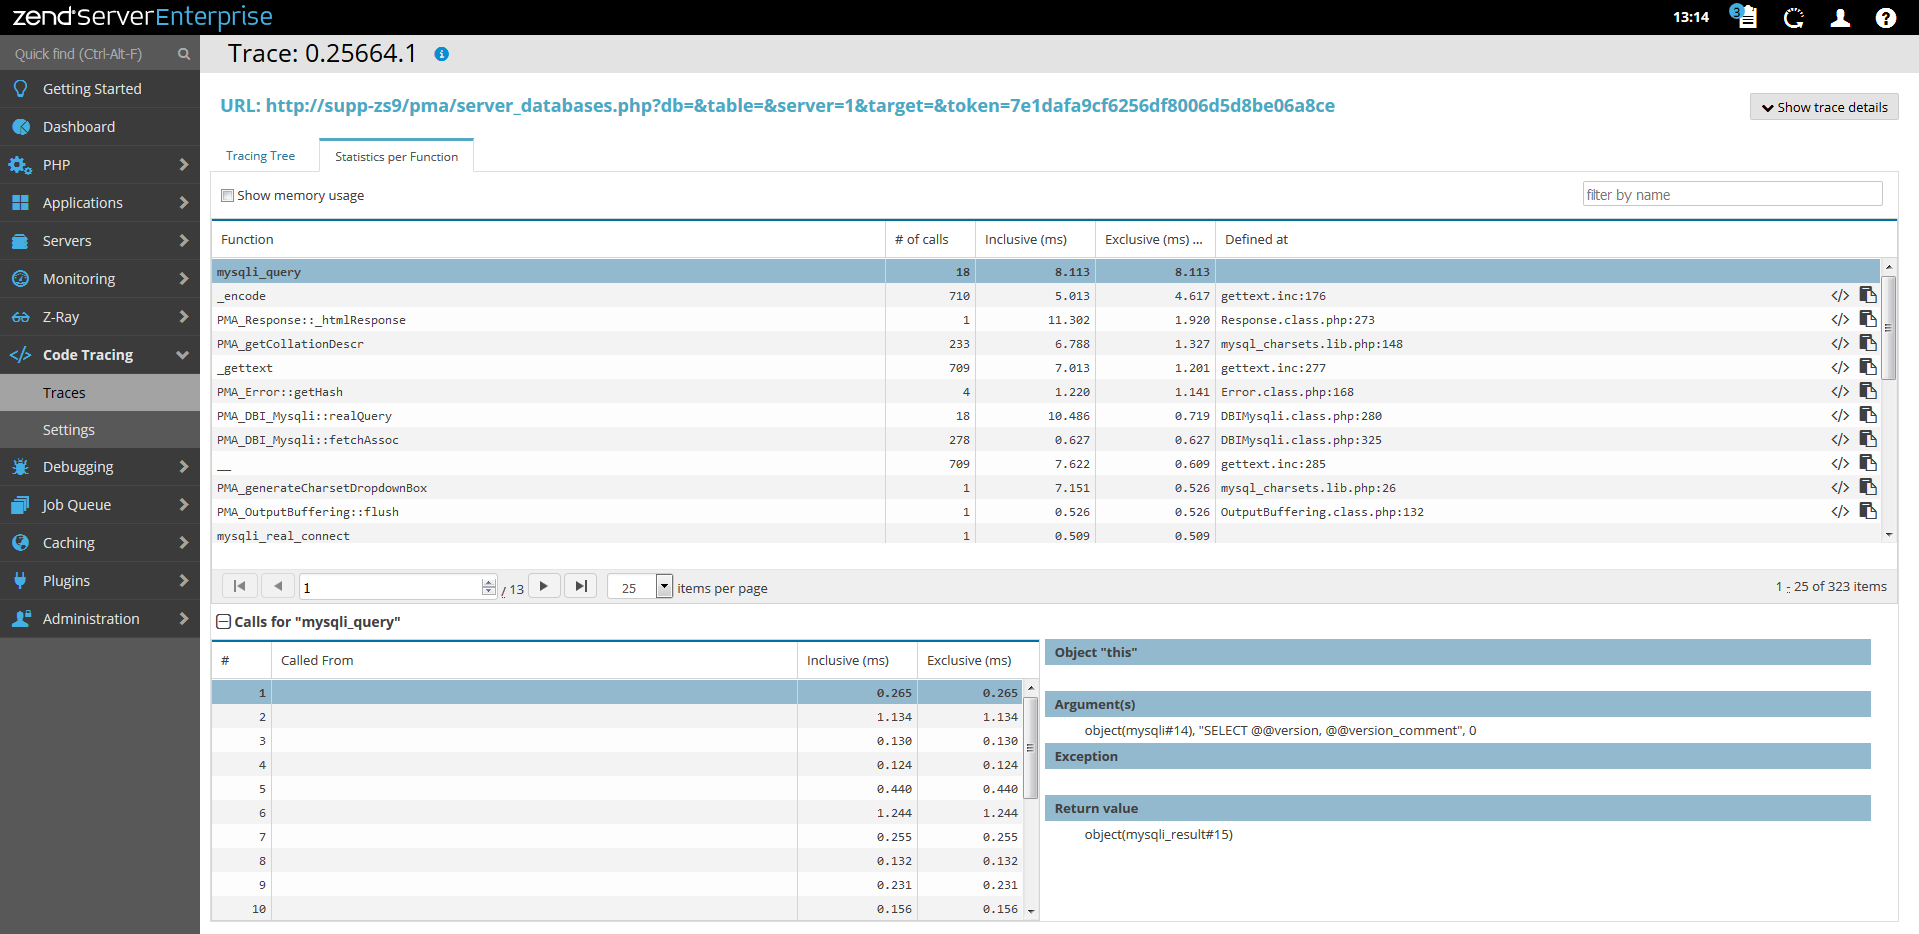
Per-Function Statistics
New features summary
- Complete redesign of the UI pages and how the data is presented.
- Each node displays its full details as data length permits. For example: (#23) MyClass::myMethod([…]) returns: […]
The above shows a situation where the arguments and return information is longer than the column width on screen display. In that case, you just click on the dotted fields […] and get a tooltip containing the full information, without leaving the current view. - For any file path used in the Code Trace there is a “Copy” button so you can examine or save the location for using elsewhere.
- Search option allows you to reduce the tree presentation to relevant nodes you wish to examine – search also expands the tree until the target node is reached.
- Timing column readability - parent node timing is lightly dropped into child nodes timing, making it easier to review time differences in tree.
Code Tracing security
In earlier Zend Server versions, we have used the Zend Debugger “Allow Hosts” configuration to secure Code Trace dumps to allowed specific IPs or Subnets only. In this new version, the configuration is separated and unique to Code Tracing component. Two directives are used, “Allow from All” when using an unrestricted machine or local development host, and “Allowed Hosts” is used for securing as needed. You can find this in the Code Tracing → Settings page.
Access per launch profile
Please note that the initial settings for Code Tracing security is done when “Launching” Zend Server, by profile selection. By default, Development profile sets it to non restrictive, while Production profile closes access to all hosts.
Code Tracing Settings page
Code Tracing has many data collection routines to date, and its not always easy to determine which ones to enable or disable for your analysis goals.
In the Code Tracing settings we included 2 basic “profiles”, which are Full, Partial and Custom.
Different profiles of Code Tracing can be used for production and development environments. Also, when jumping from full to partial, you can see that less data will be shown in partial profile, still most of the time it would be enough for runtime inspection.
Note
The data trace options of Code Tracing can also be changed, among other Code Tracing directives, under the Components → Code Tracing page, without profile context, and of course by using Web APIs.
Code Tracing reference pages:
Z-Ray
Z-Ray History
Z-Ray history is pretty much a time machine. It allows you to examine the same detail of insight which is available for Live requests in the Z-Ray toolbar, but at a later time.
Together with Monitoring Events list and Code Tracing dumps, it forms the best available arsenal of information to combat postmortem issues and get down to the root cause of runtime problems, and from there – resolve them as quickly as possible.
Z-Ray history page has a filtering system to help pinpoint that particular request that was causing issues, or is of interest to examine.
Z-Ray History Page:
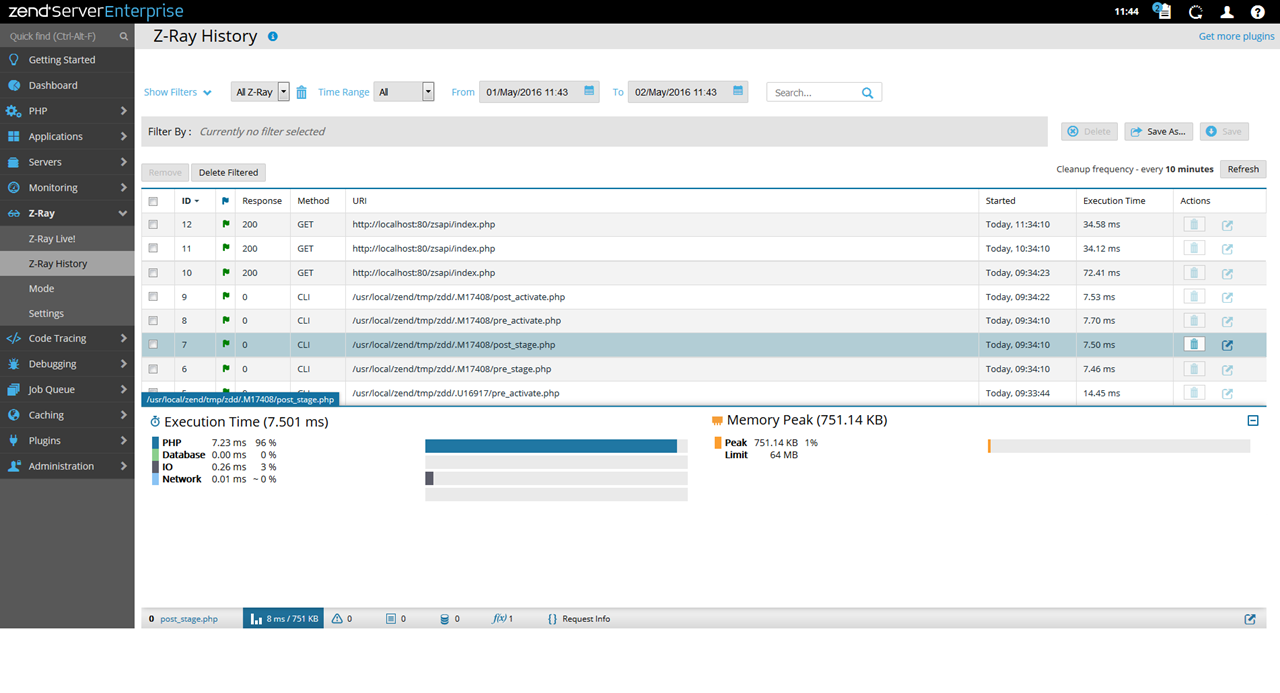
Some of the highlights of the Z-Ray history page includes:
- Filtering can be set on Severity, Method, Response and Search String.
- Sortable (by ID as default)
- Includes PHP executed by web applications, mobile apps, web services and CLI scripts (NEW)
- Maintenance settings – defaults to cleanup every 10 minutes, maximum storage of 1GB data and up-to 7 days back.
- Export to full page (see below) to save the information further.
Z-Ray Full Page
With the growing amount of data presented in Z-Ray toolbar, and by our gallery of plugins, came the need to enlarge the viewing panel, big time. So what can be bigger than full screen?
Now you can click a button and all the insight from Z-Ray is available in a new, full page view, easier to analyze and easier on the eyes.
The full page option is available in Z-ray live, application / in browser Z-Ray toolbar, Z-Ray History and also URL Insight.
You can also access full page Z-Ray with a short and friendly URL, to allow easy sharing with team members for collaboration.
One limitation exists though - “Run Action” is not available in full page Z-Ray.
Z-Ray CLI support
Z-Ray can be configured to operate on PHP CLI and view the results in Z-Ray Live!, and also find it in Z-Ray History new feature.
Z-Ray Additional changes
- Added Xdebug support for “Debug Current” Z-Ray feature.
- Added support for Glyph Icons
- Added “Pause” in case the internal page requests are not relevant so Z-Ray will stop grabbing their backend information.
Z-Ray reference pages:
Z-Ray History - Reference Page
Z-Ray Settings - Reference Page
Admin UI Improvements
Our GUI team has been working hard to improve performance and stability of Zend Server Admin UI since version 8. As a result, we migrated the to single page web application UI, powered by modern standards, using AngularJS technology.
There are immediate benefits to this change:
- Faster loading of Admin UI sections on the user end – eliminating full page reloads!
- Lowering the load on the server side, with once over few dozens of individual requests from different Admin UI sections and objects, now down to a SINGLE request!
To match the new UI architecture, many pages has been remastered in the “Angular” way. The URLs used in the Admin UI application are now more human readable. Also, inner tabs are linked directly in the URLs, and you get easier “jumps” to your target sections with desired content presented immediately after load.
Added support for Copy to Clipboard instead of manual CTRL+C as the former dialog was suggesting.
Performance wise, the Javascript resources for the UI are now served “minified” by default, resulting in a much faster loading of UI sections, especially on busy networks and servers. It's still configurable in the UI settings to allow “un-minified” Javascript code versions for debugging purposes, if needed.
Stability wise, using Grunt technology, we now immuned the Admin UI from Javascript runtime errors and overall Javascript and HTML syntax validation throughout the entire UI codebase.
And… last but not least, we replaced the loading icon with a much nicer one!
Fast Navigation / Quick Find
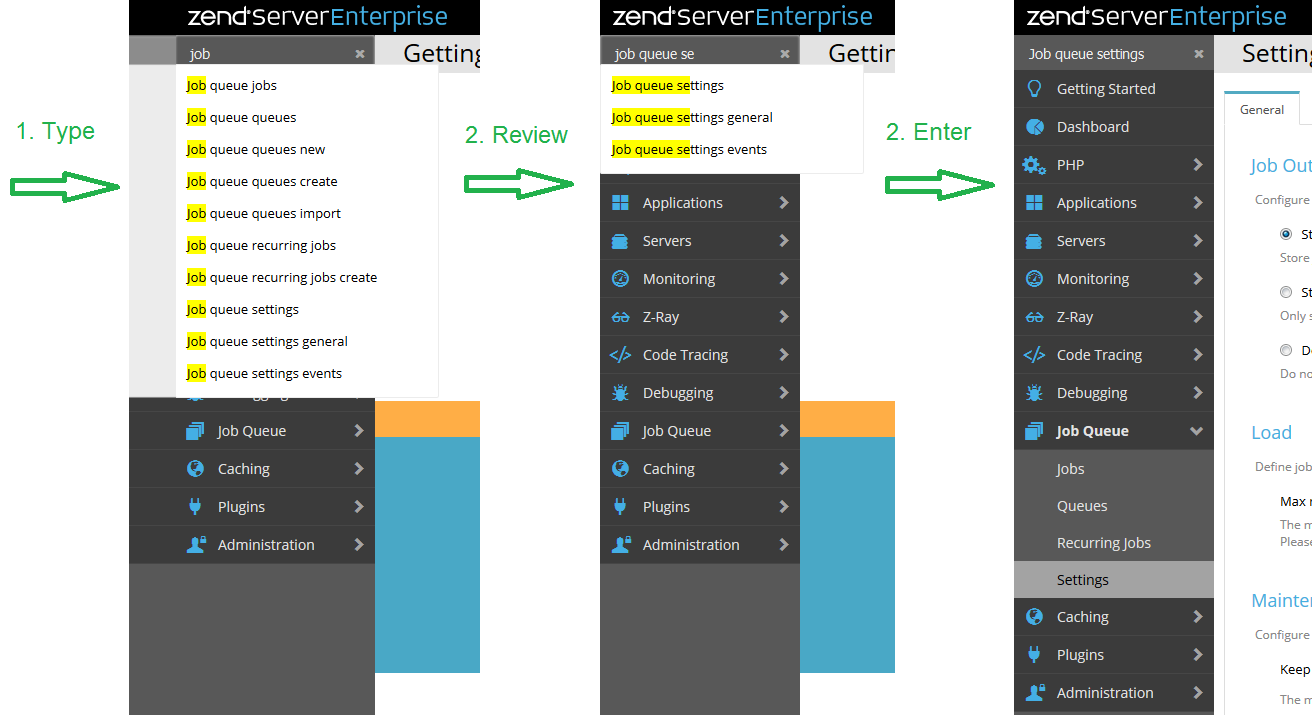
A live-search box has been added above the main menu on the top left, in order to quickly look-up Admin UI pages relevant to specific keywords. Your search is accompanied by an auto-complete box, and the results are displayed below the search box to quickly jump to a desired section in the Admin UI.
Usage Hint
The fast navigation box can also be triggered from keyboard shortcut Ctrl-Alt-F as well, so you can start typing from anywhere within the Admin UI.
Fast Navigation Search Box:
Example: Typing to get to Job Queue Settings page:
Extending the UI for fun and profit
well.. not so about fun as some wonderful fresh opportunities which are now open to advance Zend Server users, who are already familiar with writing Z-Ray Plugins and Routes.
UI Extensions is all about the user and customization, and is an advance feature. You can now create new UI pages, Web APIs which provides backend enhancements and remotely executed as any other Web API method currently available. You can also modify existing features!
UI extensions are a new type of Zend Server plugin, which has 2 more types already– Z-Ray and Route.
A Skeleton plugin is available on Skeleton plugin Github repo, with a folder named “ui”, including a set of Zend Framework 2 (ZF2) modules, which will be added to Zend Server UI modules, once deployed in your environment.
The UI extensions should be using AngularJS architecture to match the new UI infrastructure (see above), which translates to: static HTML templates loading Zend Server data using Web APIs, and manipulating the data from ZF2 controllers on the client side.
For developers who are not yet eloquent with client side development or AngularJS in particular, we included in the UI extension skeleton codebase a module with pure ZF2 MVC architecture to quickly build a compatible plugin without using AngularJS.
It might be important to note here that writing a UI extension for Zend Server is not straightforward as writing a Z-Ray plugin, and the developer should be familiar with ZF2 development, Web API versioning and defining Routes in Zend Server UI. It might be worthwhile to “snoop around” the UI existing code if the skeleton example is not verbose enough.
Additional Notable Changes and Improvements
Demo Application
The ‘Getting Started’ page has downloaded the demo package from the site, so now it always will take from the gui/data.
In any case we also updated the store package of demo.zpk for PHP7 only
Job Queue
In adding and updating recurring job was added an option to set a priority (low, normal - default , high, urgent)
NginX on Linux
Zend Server now supports native NginX packages for DEB packages. For RPM, we use packages from nginx.org repository.
Enjoy the new Zend Server 9 and PHP 7 features and benefits!


