Code Tracing Details
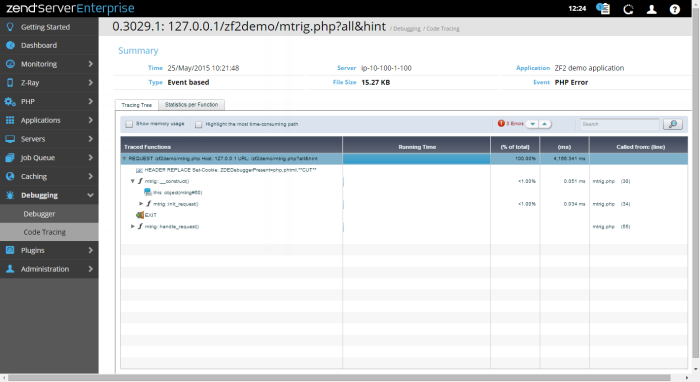
The Code Tracing Details page is displayed when selecting a trace from the Code Traces list on the Code Tracing page, and includes all available trace information, including the Code Tracing Tree and Statistics per Function tables.
This area provides a summary of the executed code trace:
- Time - Trace date and time.
- Type - Type of trace.
- Server - The server that executed the trace.
- File Size - Size of trace file.
- Application - The application associated with the trace.
- Event - The Event associated with the trace.
The Tracing Tree displays the call tree for a selected Event or trace file.
Tree Action Bar
- Show Memory Usage - Show or hide the Memory Usage column. popuping over an item in this column will display a tool tip containing a comparison of memory usage.
- Highlight most time consuming path - Shows the path that took the most time to run. Selecting this option makes the Next Child in path button appear.
- Next Child in Path - Clicking this button makes the blue indicator line and the display scroll and jump to the next child in the tree.
- Errors - An indicator for the amount of errors the code threw. Clicking on the up/down arrows will move the cursor to the error messages accordingly in the trace data and then it will return to the beginning.
- Search - A case insensitive search component for finding elements in the trace information. Entering a search item and clicking will move the blue indicator to the first instance in the trace information, each time you click on (or the return key) the indicator will move to the next instance
Tree Table Columns
-
Traced Functions: The name of the caught object in the trace file. This could be an argument, return value, function error, header etc.
-
Memory Consumed by function (bytes): The memory used by this item
-
Running Time: A graphical representation of memory usage pointing out the before/after function runtime values of the total memory usage and the difference between them. This allows you to see the before value, the memory consumption after the function was run and the difference i.e. the amount of memory the function added by running.
-
(% of total): The percentage of the total script's runtime.
-
(ms): The time it took for the function to run in milliseconds (including children).
-
Called from (line): The line of code where the event happened (in the file stated in filename).
Navigation
- In Tables: At any time you can popup over a component to see a tooltip that describes the component and in certain cases additional information.
- In the Tree tab:
- Bold items indicate calls that took the most time to execute and this continues inside the call itself – indicating the slowest calls. This indicates the application’s critical path.
- Double clicking on any item will jump to the relevant function in the Statistics tab.
The Statistics per Person displays a table-based statistical perspective of the data captured in the request.
The All Functions area includes the following columns:
- Function Name: The name of the function as it appears in the code.
- # of Calls: Function invocation count – how many times the function was called.
- Memory Consumed (all calls, bytes): Graphical and numerical representation of the memory consumed by all invocations of the function.
- To highlight/disable the display of memory usage within the trace file, mark the check-box next to Show Memory Usage.
- Total Running Time: Total time taken by this function’s invocations including nested function calls. popuping over shows a tooltip with the average time.
- Including Children: The total request time taken by this function’s invocation including nested function calls.
- Just Own: Total time taken by this function’s invocations not including nested function calls (i.e. the time it tool to call other functions).
- Located in File: The file where the function was defined. Internal functions are not defined in a file and therefore this column will be empty.
The Calls for Functions area includes the following columns:
- Memory Consumed
- Total Time
- Own Time
- Called from
- File: The file where the call happened
- Line: the line where the call happened
- Total Time: time consumed by the call, including nested functions.
- Own Time: time consumed by the call, excluding nested functions.
When selecting an item from the “Calls for Functions” list details about the actual call are displayed if it is an object.
Navigation
- In Tables: At any time you can popup over a component to see a tooltip that describes the component and in certain cases additional information.
- In the Statistics tab:
- Clicking on an item will display the function’s calls in the “Calls for Functions” area.
- Double clicking on an item the “Calls for Functions” area will open it up to show where it happened in the Tree tab.
- Clicking on an item in the “Calls for Functions” area will display the calls argument and return values if it is an Object.
Search
Enter a string in the search field  and click
  to filter the display and only show the functions that match the entered string.


