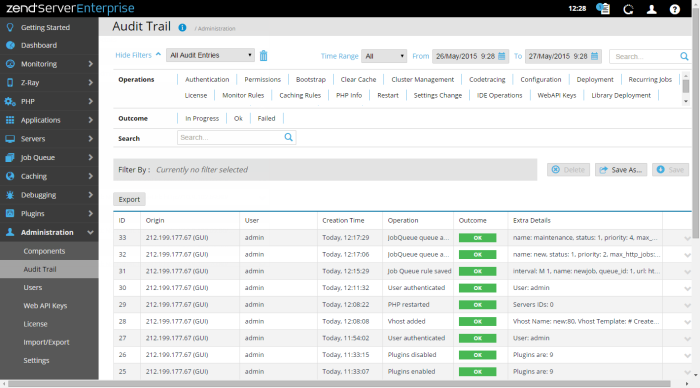
The Audit Trail page is accessed from Administration | Audit Trail, and is the default page for the Administration tab. The page is used to view the latest audited user activities taking place in your working environment, and to configure their settings.
How do I setup Zend Server to send me audit reports by email?
The Filters area is used to select and create filters for displayed audits in the Audit list. Click Show Filters to display all available filter categories and actions:
- Action Bar- Contains all filter related action items, and displayed by clicking Show Filters:
Name
Button
Description
Filter-Set Menu

Click to display list of default and saved filter-sets (Default sets: All Issues, Error Issues, Performance Issues, Resource Issues).
Clear Filters

Click to clear selected filters
Delete

Deletes a filter.
Save As

Saves a filter after customization as a new filter.
Save

Saves a new filter.
Search

Searches Audit list for entered search pattern.
- Filter list - Displays all available categories and filters:
Operations - Filters audits by action type(e.g., Application Deploy).
- Outcome - Filters audits by outcome type (e.g.,
 ).
). - Search - Filters audits by entered search pattern.
- Filter By - Displays all selected filters.
The Action bar is located at the top of the page, and is used to export the Audit log:
|
Name |
Button |
Description |
|
Export |
|
Exports the Audit Trail. |
The Audit Log is displayed in a list. The information for each audit is sorted into columns:
- ID - The ID number of the audit.
- Origin - The source of the audit: IP address of a server, and component (GUI,API,File System).
- User - Name and type of user (e.g., developer).
- Creation Time - The date and time of the audited activity.
- Operation - Name of audited action (e.g., GUI Authentication)
- Outcome - The result of the activity (


 ).
). - Extra Details - Additional related information (e.g., Extension name: Zend Code Tracing, Directive: zend_codetracing.max_depth, Old value: 2, New value: 3).
The expanded view is displayed when selecting an audit from the list, or clicking the Expand View arrow  on the right side of the audit line, and displays a stage breakdown of the audited activity:
- Server Name - The name of the server performing the activity stage.
- Progress - The progress status of the activity stage (e.g., Started).
- Time - The date and time of the activity stage.
- Extra Information - Additional information.


