Zend Server Best Practices > Development > Profiling

Profiling

To access this option from the UI, go to Overview | Events, select an event from the list and click on the event's ID number to view the Event details page.

This procedure describes how to profile an event from inside Zend Server for IBMi. Profiling from inside an event provides an additional diagnostics layer in order to investigate why a specific event was triggered by analyzing code execution performance with Zend Studio.

Important!

Before following this procedure make sure that Zend Server for IBMi and Zend Studio are running and properly setup.


Instructions on how to complete a procedure

To Profile an event:

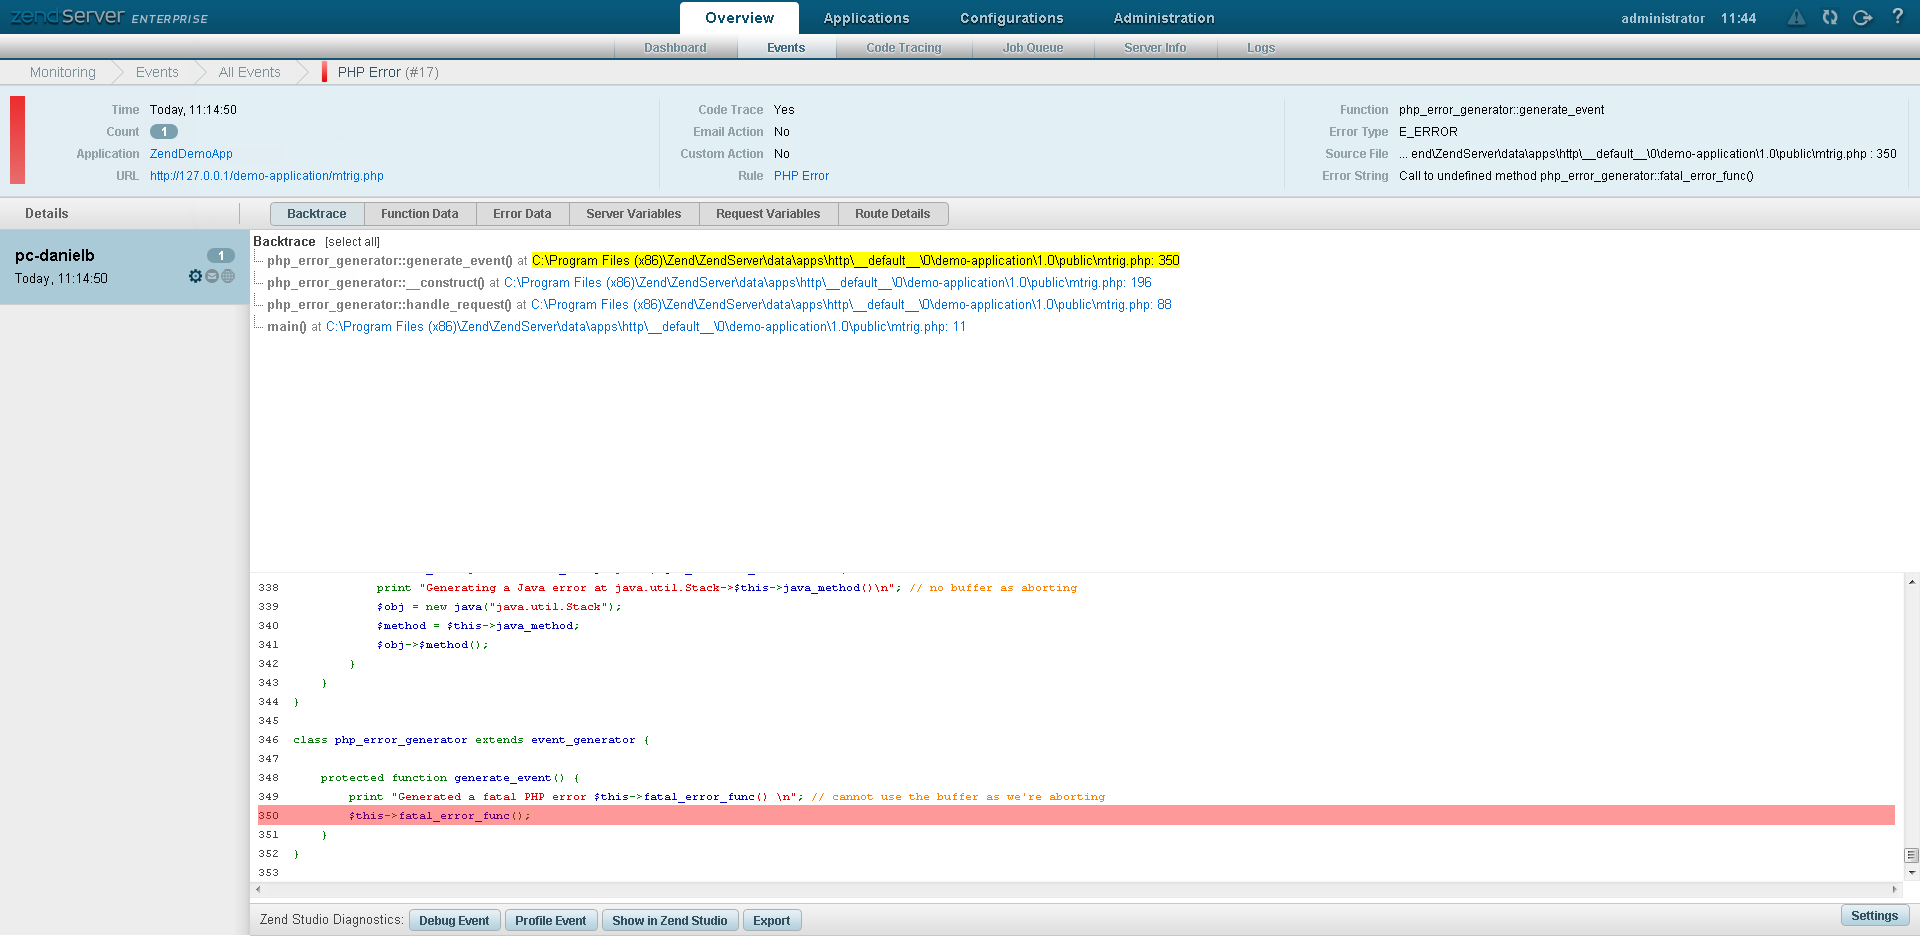
  1. In the UI, go to Overview | Events, select an event from the Events list, and click on the event's ID number to view the Event details page.

  1. In the Zend Studio diagnostics area click .
    By default, the settings are set to run diagnostic actions on the originating server (the server on which the event was created). You can change the settings to run on a different server.

  1. The information will be transferred to the Zend Studio PHP Profile preference where you can run profile and edit the file.

If this did not work, see the Troubleshooting section.


Related Links

Related Links:

Working with the Debugger

Working with Firewall Tunneling

Working with Local Debugging


© 1999-2013 Zend Technologies, Ltd. All rights reserved.