The table below describes the available statistical charts that are displayed on the Overview | Dashboard page, and details the various ways to view them.
How to I work with Zend Server Statistics?
Name |
Description |
Type |
Statistics Tab |
Actions |
Example |
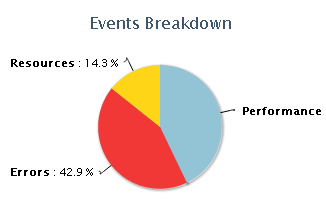
Events Breakdown |
Type of events that occurred in the selected time range (Performance, Errors, Resources) |
Pie |
Overview |
Hover over segment displays number of events. Filter by time range. Click an event segment will take you to the relevant filtered events on the Events page. Expand chart.
|
|
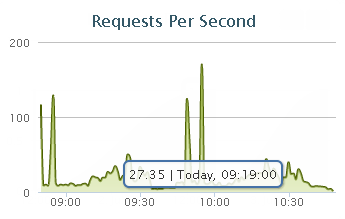
Requests per Second |
Number of requests that occurred per second in the selected time range |
Graph |
Overview |
Hover over point in graph displays details (number of requests, time stamp). Select a segment of the graph to zoom in. Filter by time range. Expand chart. |
|
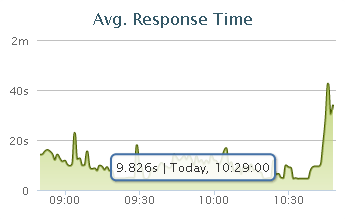
Avg. Response Time |
Average amount of time for responding to requests |
Graph |
Overview |
Hover over point in graph displays details (response time, time stamp). Select a segment of the graph to zoom in. Filter by time range. Expand chart. |
|
Name |
Description |
Type |
Statistics Tab |
Actions |
Example |
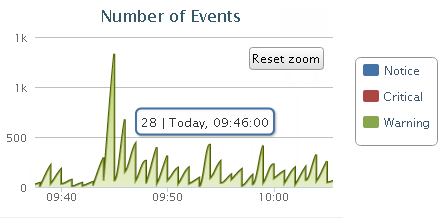
Number of Events |
Number of events that occurred in the selected time range |
Graph |
System Health |
Hover over segment displays details (number of events, time stamp). Select a segment of the graph to zoom in. Filter by time range. Expand chart. |
|
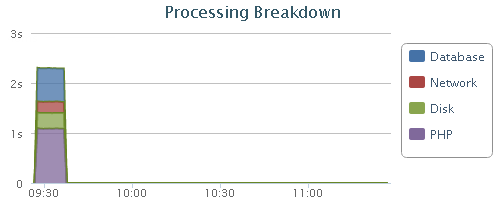
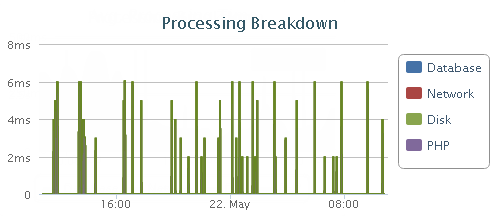
Processing Breakdown |
Average amount of time for processing requests by type of component (Database, Network, Disk, PHP). |
Graph |
System Health |
Hover over point in graph displays details (amount of time, time stamp). Select a segment of the graph to zoom in. Select a component filter to further filter data (Database, Network, Disk, PHP). Filter by time range. Expand chart. |
|
Name |
Description |
Type |
Statistics Tab |
Actions |
Example |
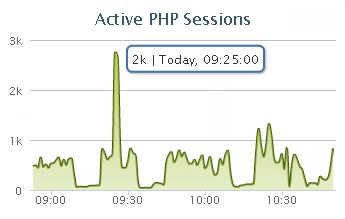
Active |
The number of unique sessions used in the selected time range |
Graph |
System Utilization |
Hover over point in graph displays details (number of sessions, time stamp). Select a segment of the graph to zoom in. Filter by time range. Expand chart. |
|
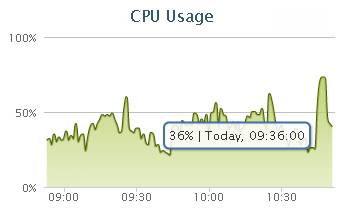
CPU Usage |
The percentage of CPU used in the selected time range |
Graph |
System Utilization |
Hover over segment displays details (usage percentage, time stamp). Select a segment of the graph to zoom in. Filter by time range. Expand chart. |
|
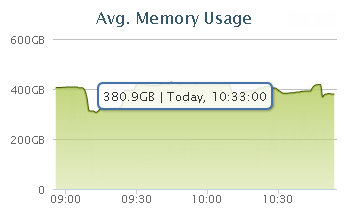
Avg. Memory Usage |
The average amount of memory used in the selected time range |
Graph |
System Utilization |
Hover over point in graph displays details (size of used memory, time stamp). Select a segment of the graph to zoom in. Filter by time range. Expand chart. |
|
Name |
Description |
Type |
Statistics Tab |
Actions |
Example |
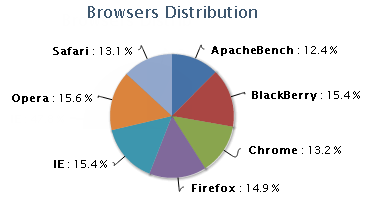
Browser Distribution |
Usage percentage according to type of browser used |
Pie |
Usage Statistics |
Hover over segment displays browser usage percentages. Filter by time range. Expand chart. |
|
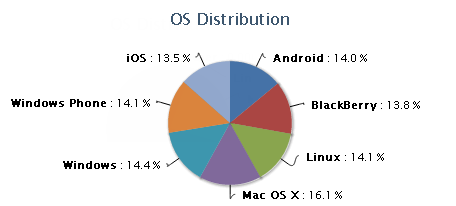
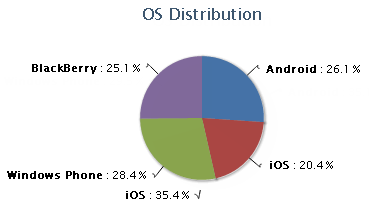
OS Distribution |
Usage percentage according to type of OS used |
Pie |
Usage Statistics |
Hover over segment displays OS usage percentages. Filter by time range. Expand chart. |
|
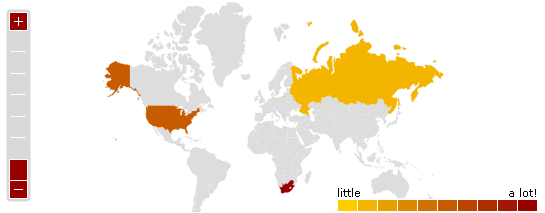
Geographical Distribution |
Number of user according to geographic location |
Map |
Usage Statistics |
Hover over segment displays number of users. Zoom in and out of geographic location. Expand chart. |
|
Name |
Description |
Type |
Statistics Tab |
Actions |
Example |
OS Distribution |
Usage percentage according to type of mobile OS used |
Pie |
Mobile Usage |
Hover over segment displays OS usage percentages. Filter by time range. Expand chart. |
|
Mobile Vs. Desktop |
Usage percentage according to device used |
Graph |
Mobile Usage |
Hover over point in graph displays details (size of used memory, time stamp). Select a segment of the graph to zoom in. Filter by time range. Expand chart. |
Name |
Description |
Type |
Statistics Tab |
Actions |
Example |
Requests Per Second |
Number of requests that occurred per second in the selected time range |
Graph |
Mobile Statistics |
Hover over point in graph displays details (size of used memory, time stamp). Select a segment of the graph to zoom in. Filter by time range. Expand chart. |
|
Processing Breakdown |
Usage percentage according to type of mobile OS used |
Graph |
Mobile Statistics |
Hover over point in graph displays details (size of used memory, time stamp). Select a segment of the graph to zoom in. Filter by time range. Expand chart. |
|
|
|
|
Related Links: |
|
|
© 1999-2013 Zend Technologies, Ltd. All rights reserved.