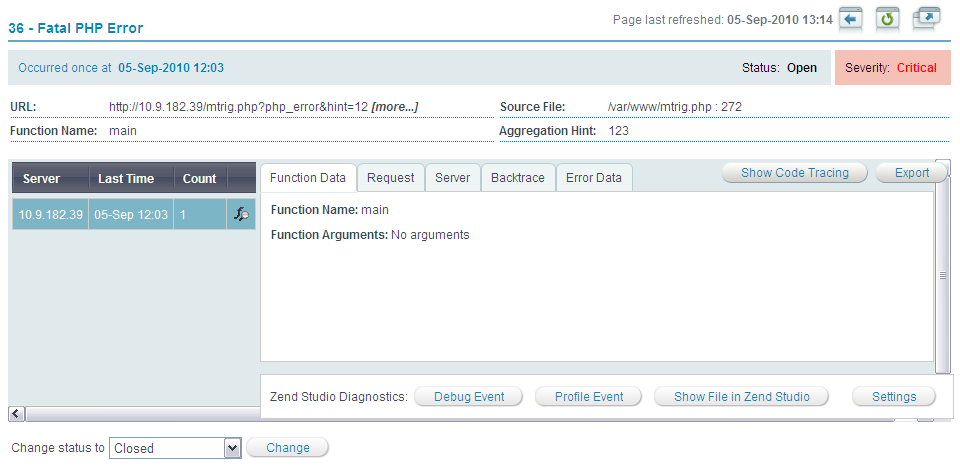
The Zend Server Cluster Manager Event Details page, is accessed from Monitor | EventsEvents are a result of the monitoring component checking your system and collecting information about a specific occurrence that indicates that your environment is displaying uncharacteristic behavior. by selecting an event from the list and clicking on the row.
Aggregated events are events that are collected from all the servers that belong to the cluster. An event can occur on a single server or on some or all servers. the events details page helps to identify the source of the event and the server/s on which it happened.
The Event Details page is the main display area for aggregated information
regarding the occurrence of a specific type of event in your cluster.
Information on how an event is triggered is presented in

Note:
Not all events display the same information. Only information relevant to the specific event type will be shown.
The following actions can be performed from the Event Details page:
On the Event Details page, users can view a general summary of an occurrence, its status and diagnose the occurrence with Zend Studio for Eclipse.
The following list describes the information types displayed in the Event Details Page
Top Bar:
Event Details Table:
Events are aggregated into groups based on the time they occurred. The
aggregation is set to five minutes: Thus, all the events that occur within
that time frame are grouped together. Each time a set of events is aggregated
(i.e., a new group is created), the occurrence details are collected again.
To view the event occurrence details for a group, click on the group in
the Event Details table: The display on the right will change to display
the following options.
The Event Details Table options are:
Node - The server on which the event occurred .If the node's status is "Unknown" the details you are viewing were collected from a node that no longer belongs to the cluster.
Clicking on one of these options updates the display with the relevant information.
Event Details
The Event Details are a collection of information relevant to the event that occurred. Clicking on a time in the table on the left (Event Details Table) will display the information relevant to the selected occurrence/es. Through this you can find out for example, if a different function caused the error or if a different message was thrown.
The following list presents the possible details that can be displayed for a specific occurrence:
|
|
|
|
|
Related Links: |
|
|
|
© 1999-2013 Zend Technologies, Ltd. All rights reserved.