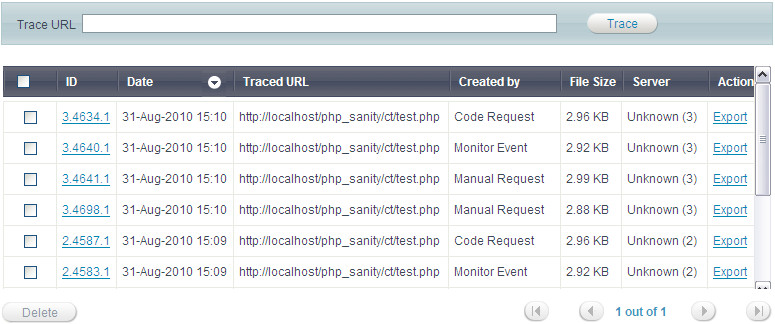
The Code Tracing page is accessed from Monitor | Code Tracing.
The Code Tracing page is a central display and management area for all traced information. In addition Trace information can be viewed per event by drilling-down to a specific event in Monitor | Events.
Zend Server Code Tracing captures full execution data of PHP applications in real time. The execution data includes function call trees, arguments and return values, function execution duration, memory usage and indication for an executed file's name and line of code. This enables you to capture problems when they occur, which eliminates the need to set up environments and reproduce the steps that led up to the failure.

The trace displayed in the Zend Server web console enables you to view the execution history of your application and follow in the footsteps of an individual, problematic request to quickly pinpoint root cause. Furthermore, the Export option allows you to transfer this information into Zend Server allowing you to transfer the information to developers.
Zend Server Code Tracing is an in-depth diagnostic tool that will allow you to drill-down to the function level to view actual performance related information and statistics.
Trace information can be collected in one of two ways:
Collected
as an additional level of event information by Monitor Rules mechanism
to generate a trace when an event occurs.
Traced information can contain information on more than one event that
occurred according to the reoccurrences of the event.
Manually Triggered
From this page you can:
|
|
|
Related Links: |
|
|