![]()
To Profile an event:
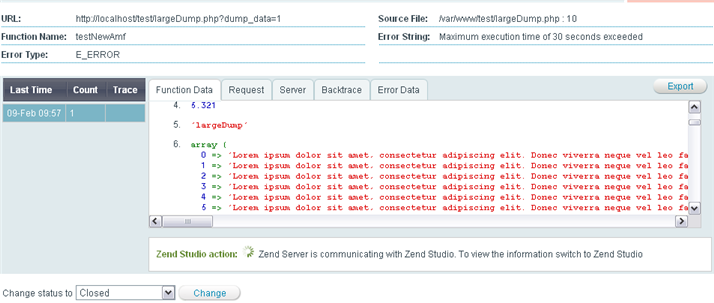
Open an event by going to Monitor | Events, selecting an event from the list and clicking on the event's ID number to view the details page.
In the Zend Studio diagnostics area click

This action will run on the server defined in .
By default, the settings are set to run diagnostic actions
on the originating server (the server on which the event was
created). You can change the settings to run on a different
server.

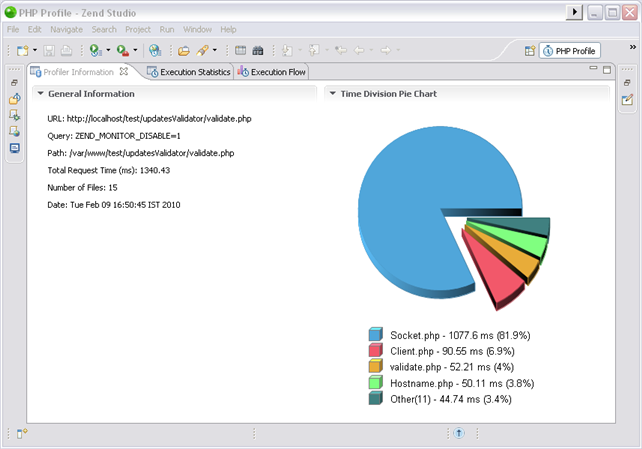
The information will be transferred to the Zend Studio PHP Profile preference where you can run profile and edit the file.

If this did not work see if one of these troubleshoot options help