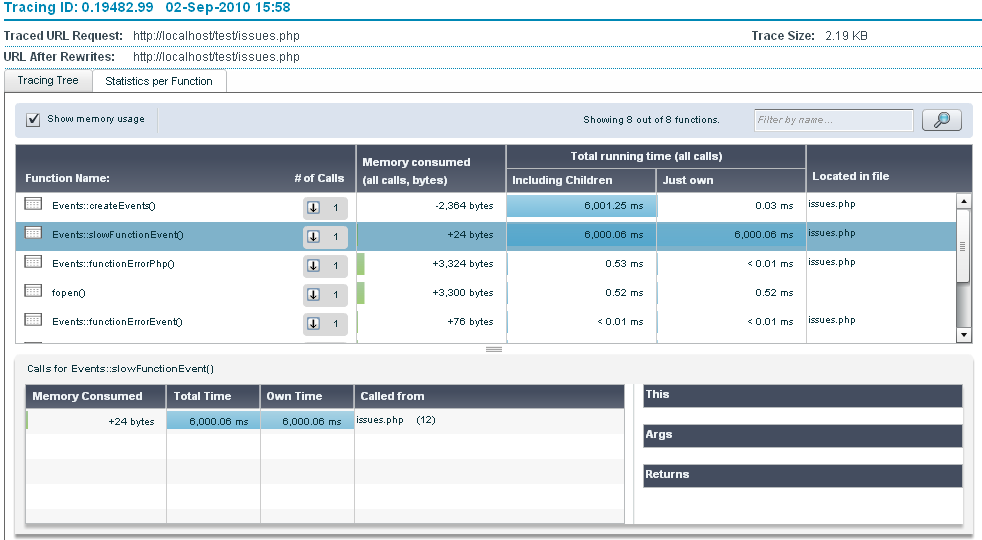
Code Tracing Tree is accessed from Monitor | Tracing by selecting a trace ID from the list.
The Statistics per Function tab is a table based display that provides
a statistical perspective of the data captured in the request. The same
data is displayed in two different ways. The “All functions” area at the
top that lists all the functions included in the dump for a certain occurrence
and the “Calls for Functions” area at the bottom that displays the function
calls for a function selected from the list (by clicking on the function).
Use this tab to investigate performance information such as the slowest
function (sorting the table by 'own time' will help pinpoint this).

The “All Functions” area includes the following columns:
Function Name: The name of the function as it appears in the code.
# of Calls: Function invocation count – how many times the function was called.
Memory Consumed (all calls,
bytes): Graphical and numerical representation of the memory
consumed by all invocations of the function.
To highlight/disable the display of memory usage within the trace file,
mark the check-box next to "Show
Memory Usage"
Total Running Time: Total time taken by this function’s invocations including nested function calls. Hovering over shows a tooltip with the average time.
Including Children: The total request time taken by this function’s invocation including nested function calls.
Just Own: Total time taken by this function’s invocations not including nested function calls (i.e. the time it tool to call other functions).
Located in File: The file where the function was defined. Internal functions are not defined in a file and therefore this column will be empty.
The “Calls for Functions” area includes the following columns:
When selecting an item from the “Calls for Functions” list details about the actual call are displayed if it is an object.
In Tables:
In the Statistics tab:
Search:
Enter a string in the search section ![]() and click
and click ![]() to filter the display and only show the functions that
match the entered string.
to filter the display and only show the functions that
match the entered string.
|
|
|
Related Links: Code Tracing |
|
|