Code Tracing Tree
The Code Tracing Tree is accessed from Monitor | Tracing and selecting a trace ID from the list.
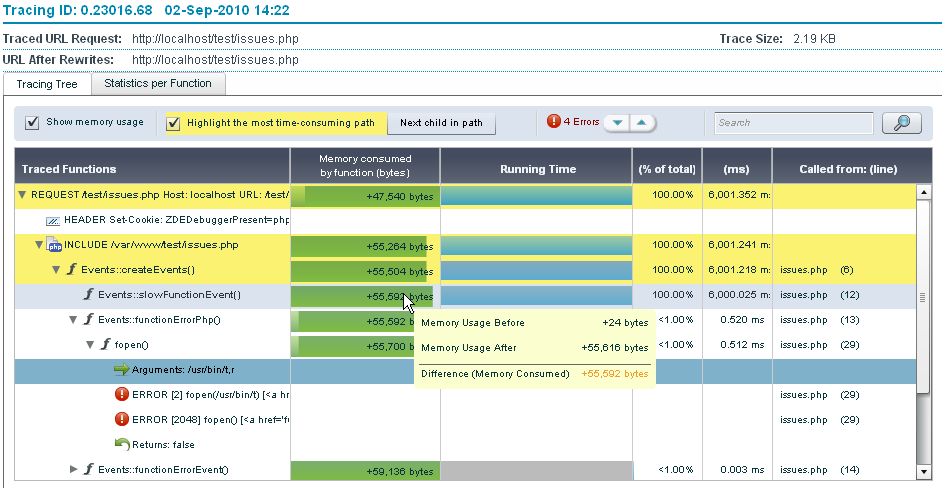
The Tree tab displays the call tree for a selected event or trace file.

Display Options:
- Show Memory Usage - Show or hide the Memory Usage column. Hovering over an item in this column will display a tool tip containing a comparison of memory usage.
- Highlight most time consuming path - shows the path that took the most time to run.
Selecting this option makes the Next Child in path button appear:
Next Child in Path - Clicking this button makes the blue indicator line and the display scroll and jump to the next child in the tree.
- Errors - An indicator for the amount of errors the code threw. Clicking on the up/down arrows will move the cursor to the error messages accordingly in the trace data and then it will return to the beginning.
- Search - a case insensitive search component for finding elements in the trace information. Entering a search item and clicking
 will move the blue indicator to the first instance in the trace information, each time you click on
  (or the return key) the indicator will move to the next instance
The Tree includes the following columns:
- Traced Functions: The name of the caught object in the trace file. This could be an argument, return value, function error, header etc.
- Memory Consumed by function (bytes): The memory used by this item
- Running Time: A graphical representation of memory usage pointing out the before/after function runtime values of the total memory usage and the difference between them. This allows you to see the before value, the memory consumption after the function was run and the difference i.e. the amount of memory the function added by running.
- (% of total): The percentage of the total script's runtime.
- (ms): The time it took for the function to run in milliseconds (including children).
- Called from (line): The line of code where the event happened (in the file stated in filename).
Navigation
In Tables:
- At any time you can hover over a component to see a tooltip that describes the component and in certain cases additional information.
In the Tree tab:
- Bold items indicate calls that took the most time to execute and this continues inside the call itself – indicating the slowest calls.
This indicates the application’s critical path.
- Double clicking on any item will jump to the relevant function in the Statistics tab.

