URL Insight
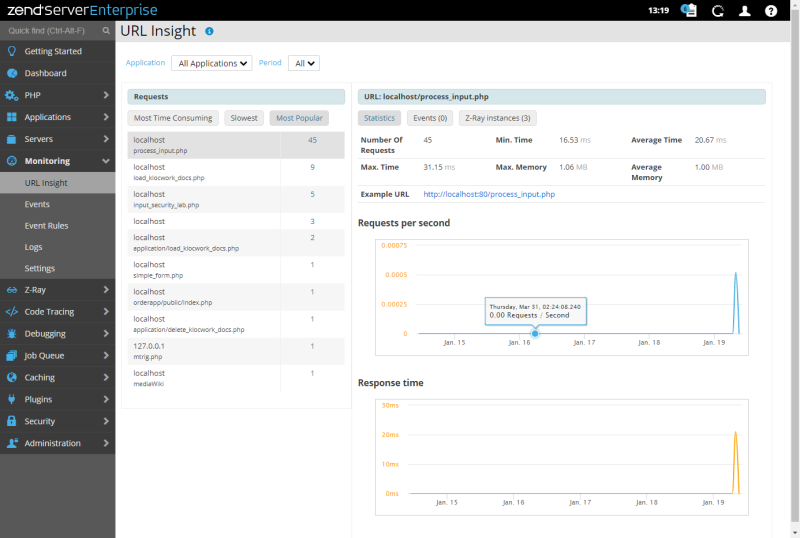
The URL Insight page is accessed from Monitoring | URL Insight and is used for viewing detailed reports and information on specific requests for PHP pages located on your web server.
How do I work with URL Insight?
The Filter Bar is located at the top of the page, and is used to filter the information to be displayed in the URL reports below:
- Application - This filter allows you to filter the reports by an application managed by Zend Server.
- Period - This filter allows you to filter the reports according to a specific time period (Last 2 Hours, Last 24 Hours, Last 48 Hours, Last Week, Last Month, Last 3 Months, Last 6 Months, Last Year, All).
The Requests panel contains three separate reports for PHP pages located on your Web server. When you select a report, the requests are ordered by your selection and information about that request displays in the panel on the right. The reports are:
- Most Time Consuming - Requests that consumed the most time from the Web server (i.e. average server processing time X number of requests).
- Slowest - Requests with the slowest response time from the Web server.
- Most Popular - Most frequently called requests.
Below the reports is a list of ten URLs associated with your selected applications and report.
Note:
URL Insight can detect whether a MVC structure was used or not. When detected, the MVC controller and action will be displayed.
Statistics
The Statistics section displays general information on a URL.
- Number of requests - Number of times the request was sent to the Web server.
- Min. Time - Minimum amount of time consumed by the request.
- Avg. Time - Average amount of time consumed by the request.
- Max. Time - Maximum amount of time consumed by the request.
- Max. Memory - Maximum amount of memory consumed by the request.
- Avg. Memory - Average amount of memory consumed by the request.
- Example URL - The complete path of the selected URL.
Below the statistics two graphs show requests per second and response time over time, reflecting the performance of the URL selected in the URLs list.
Events
The Events section shows a table of the latest critical events: when the event occurred, what the event was, a description of the event, and the number of occurrences. You can open the event details for more information about the critical event.
Z-Ray instances
The Z-Ray instances section displays a selection of snapshots of Z-Ray across time, at set intervals of 30 minutes, giving you in-depth visibility on a URL selected in the URL Reports section.

