Architecture
This section describes how the Zend Enterprise Web Platform is structured: the runtime architecture of a deployed platform, a short primer on the Kubernetes and Helm concepts the platform relies on, and an explanation of the umbrella chart model that ties everything together.
Architectural diagram
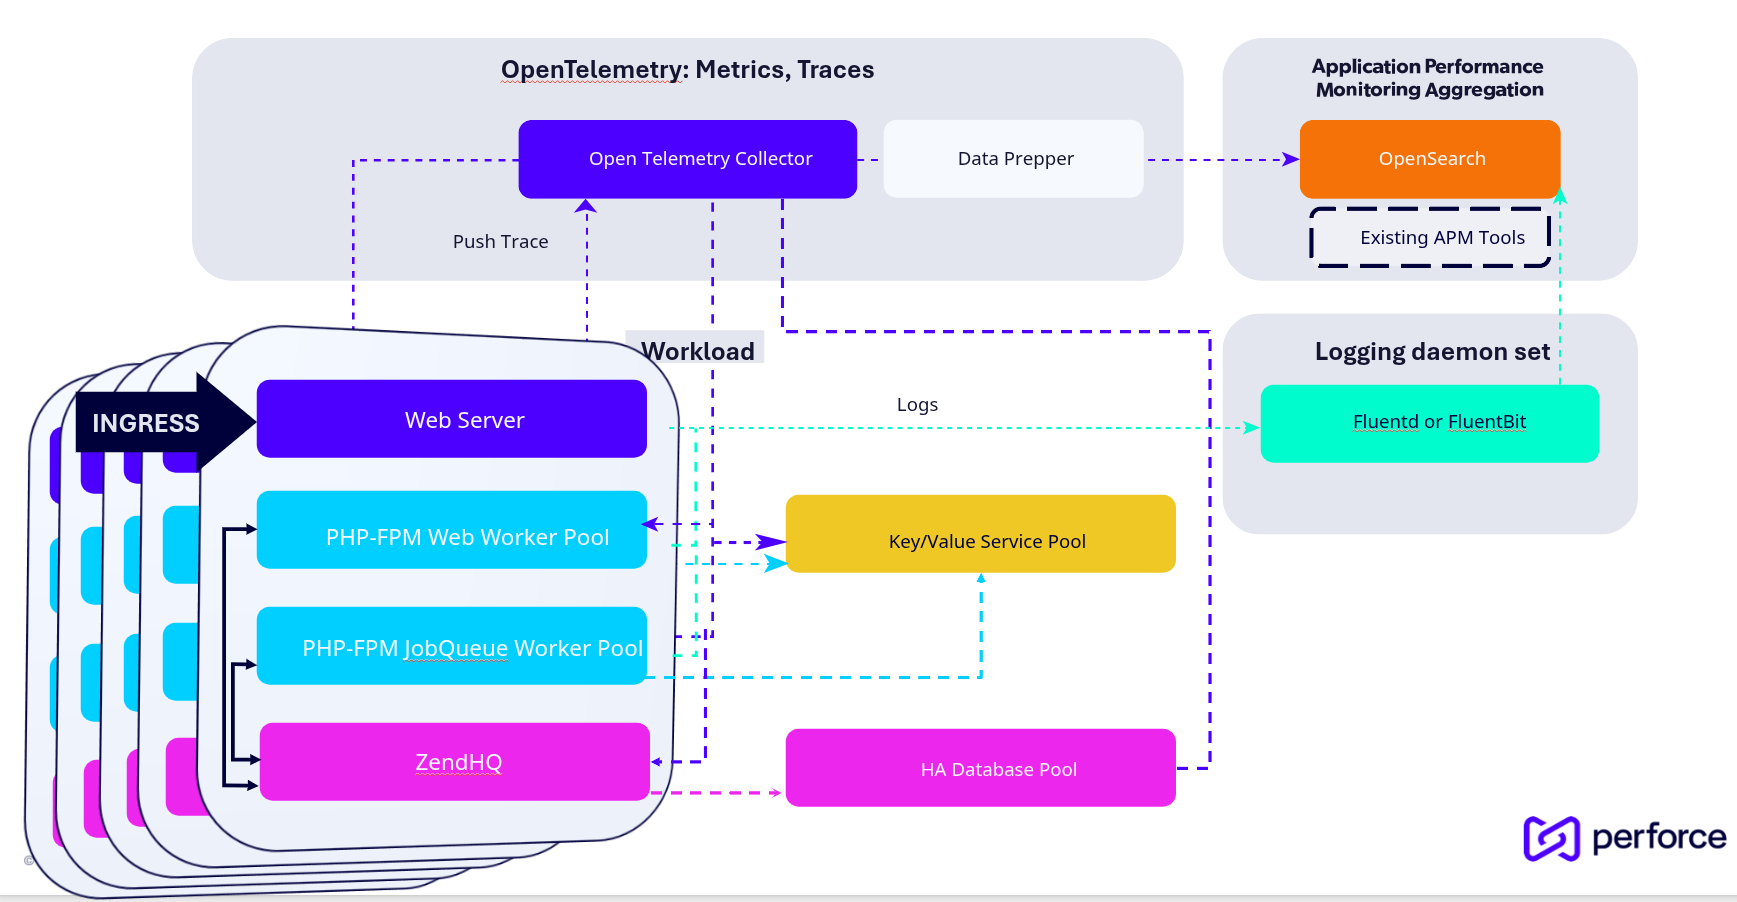
The diagram above shows the major moving parts of a deployed platform and how data flows between them.
The workload
At the center is the workload the set of pods that make up one or more PHP applications. Each application is composed of several cooperating containers:
- Web Server: An nginx container that terminates incoming HTTP requests and proxies dynamic requests to PHP-FPM over FastCGI.
- PHP-FPM Web Worker Pool: The PHP-FPM processes that run your application code and serve web requests.
- PHP-FPM JobQueue Worker Pool: Optional PHP-FPM processes dedicated to running background jobs dispatched through ZendHQ Job Queue.
- ZendHQ: The per-application monitoring and Job Queue management service.
Requests enter through Ingress (the Gateway), which routes them to the correct application's web server based on hostname. The stacked panels in the diagram represent the fact that a single platform can host many applications side by side, each with its own copy of these containers.
Shared service pools
The workload depends on two stateful service pools:
- Key/Value Service Pool (Redis): Used for session clustering and data caching. The web pool, Job Queue pool, and ZendHQ all connect to it.
- HA Database Pool (MySQL): A high-availability MySQL cluster used by ZendHQ to persist monitoring data.
Observability pipeline
The right side of the diagram shows how telemetry leaves the workload:
- OpenTelemetry: Metrics, Traces: The application and gateway push traces to the OpenTelemetry Collector, which forwards data through Data Prepper into OpenSearch for storage and analysis. The collector can additionally feed existing APM tools if you already run one.
- Logging daemon set - Fluentd/FluentBit: Runs on every node as a DaemonSet, gathering container logs and shipping them to OpenSearch.
- Application Performance Monitoring Aggregation - OpenSearch: Is the destination for logs, metrics, and traces, and OpenSearch Dashboards (not shown explicitly) visualizes them.
The dashed lines represent telemetry flows (traces, logs, metrics), while the solid lines represent request and data-access paths within the workload.
A quick introduction to Kubernetes and Helm
The platform is built on Kubernetes and delivered with Helm. You do not need to be an expert in either, but a working mental model helps when operating and troubleshooting a deployment.
What is Kubernetes?
Kubernetes is a distributed systems control plane that lets you run, scale, and heal containerized applications across a cluster of machines.
In practice, Kubernetes lets you:
- Describe the desired state of your application. How many replicas to run, when to scale them up or down, how the application is exposed (hostname, port, path), and how persistent storage is handled.
- Run your containers and continuously report their status, restarting or rescheduling them when something fails.
- Abstract away the physical deployment. The same description works whether you run on a single machine, many machines, on-premises, in the cloud, or in a hybrid environment.
Kubernetes describes the world in terms of resources, including:
- Services: Anything with a port that should be reachable within the cluster, or which could be exposed externally.
- Deployments and StatefulSets: Descriptions of containers and the resources they consume (memory, CPU, storage). The running instances they create are called pods.
- Persistent Volumes (PV) and Persistent Volume Claims (PVC): Persistent storage and the requests for it.
- ConfigMaps and Secrets: Configuration and sensitive configuration, respectively.
- Jobs: Containers that run a one-off command to completion.
- …and a great deal more.
Where does Helm fit in?
Kubernetes is powerful but verbose. Describing every resource by hand:
- Takes time and is error-prone.
- Requires getting the order of application correct.
- Involves a lot of near-identical, repeated configuration.
- Exposes many low-level implementation details (volumes, service ports, and so on).
Helm simplifies how you consume Kubernetes. With Helm you can:
- Define a standard resource once and customize it with template variables.
- Repeat common configuration by looping over values.
- Rely on Helm to send everything to Kubernetes in the right order.
- Reuse the same chart multiple times.
- Publish charts so others can reuse them.
For example, the same PHP application definition can be reused for several applications, with only the environment variables and image differing. Helm makes that a matter of supplying different values, not rewriting manifests.
A chart ships with a values.yaml file that lists every value you can override. When you install or upgrade, you provide one or more values override files with the -f flag (which may be repeated); Helm merges them left to right, with later files taking precedence, and renders the final set of Kubernetes resources.
What is an umbrella chart?
ZEWP is delivered as a Helm umbrella chart: a chart whose primary job is to compose other charts. Each integrated service of the platform - Redis, MySQL, the OpenTelemetry collector, OpenSearch, the gateway, and so on is defined in its own subchart. The umbrella chart pulls them together into a single installable unit.
This design exists for several reasons:
- Independent evolution. Each service can advance at its own pace without forcing changes on the others.
- Selective enablement. You can enable or disable each composed service. If you already run MySQL elsewhere in your infrastructure, for example, you can disable the bundled MySQL subchart and point ZendHQ at your existing database.
- Maintainability. Keeping each service's templates and defaults in a dedicated subchart keeps the overall chart manageable.
How configuration maps to subcharts
Within a values file, there is a top-level key for each subchart. For example:
global:            # cross-cutting configuration shared by all subcharts
  # ...
zendphp-web:       # the PHP-FPM web pool subchart
  # ...
zendphp-job-queue: # the Job Queue worker subchart
  # ...
zendphp-zendhq:    # the ZendHQ subchart
  # ...
zendphp-redis:     # the Redis subchart
  # ...
zendphp-mysql:     # the MySQL subchart
  # ...
The special global key holds cross-cutting configuration that more than one subchart needs to see the gateway configuration, the list of PHP applications to expose, the MySQL connection details, the OpenTelemetry collector endpoint, registry settings, and so on.
Because each subchart can be enabled or disabled, the umbrella chart is also how the platform stays flexible: a minimal deployment might enable only the web pool and ZendHQ, while a full production deployment enables the complete observability and HA data tiers.